A song’s audio features become something you can keep.
What began as an experiment with soft circles and ellipses has grown into three algorithms: Resonance, Pigment and Classic. Each reads the same six values through a different visual language, from sculpted filaments to rough paint and quiet geometry.
As It Was, one set of values, three algorithms.
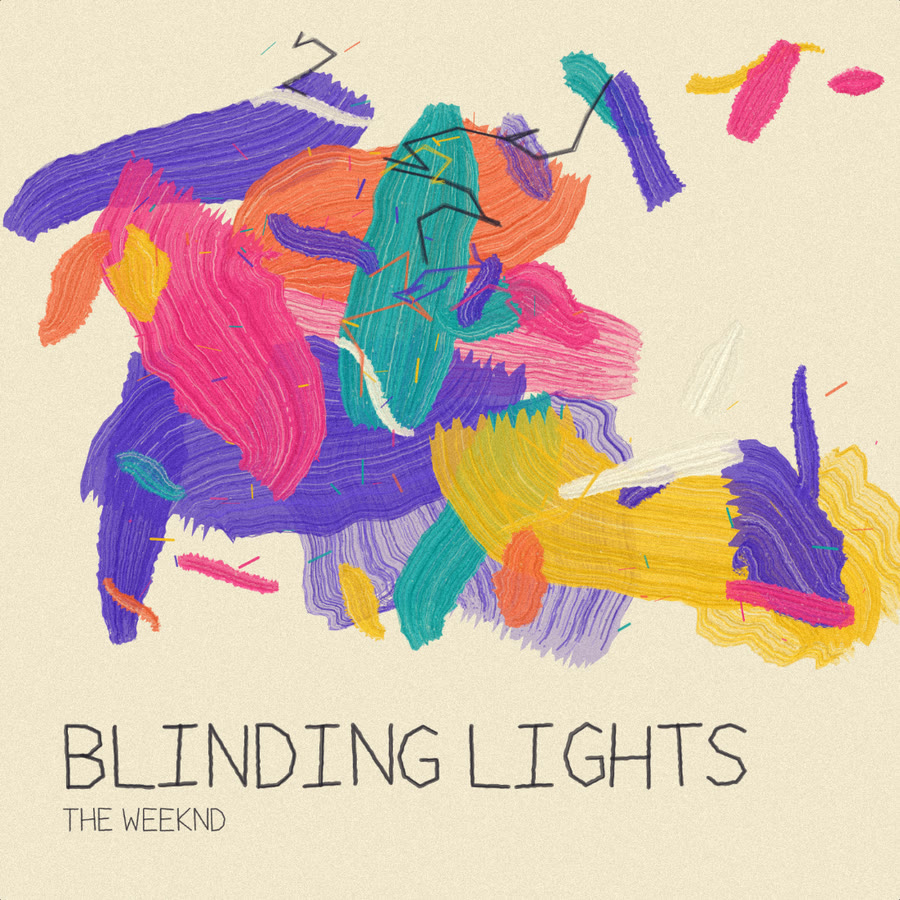
Blinding Lights in Pigment: another song, another painting.
The data
The values don’t spread out evenly.
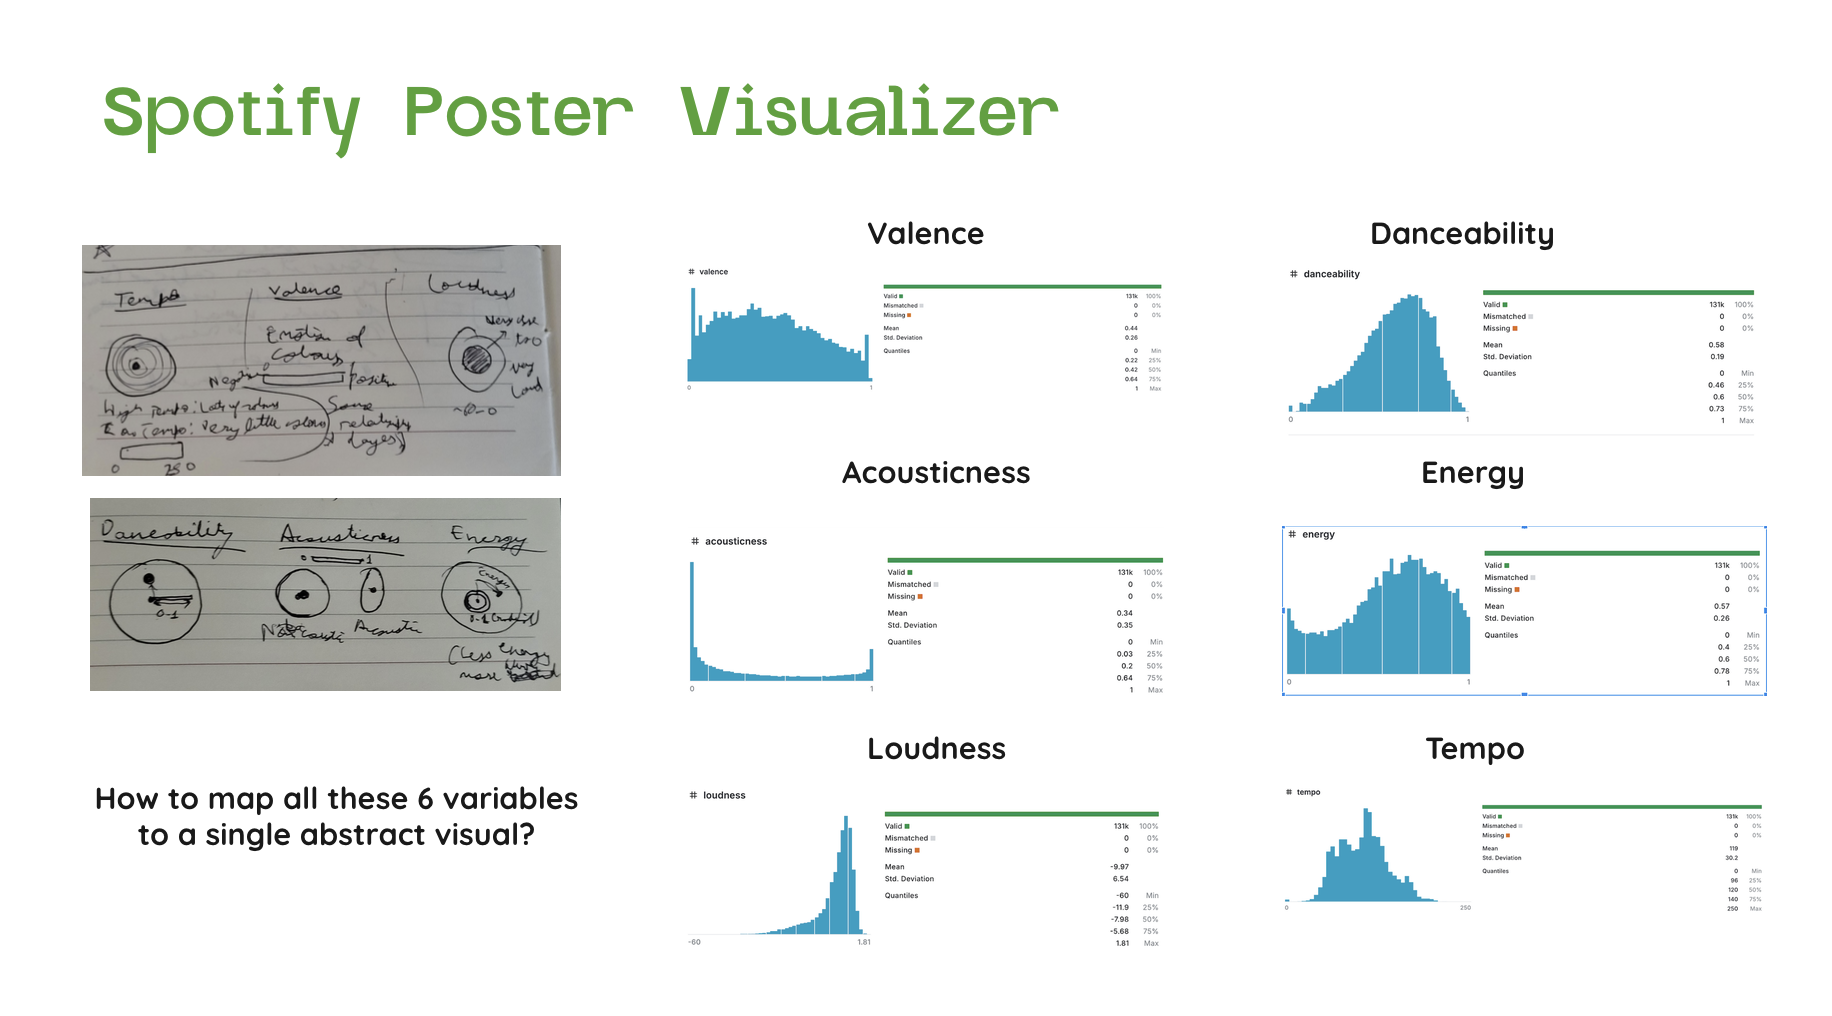
Before choosing a visual form, I looked at what each number says about a song. Four features use a 0–1 scale; loudness and tempo keep their own units. Replotted across all 114,000 records, acousticness concentrates near zero while energy leans high, so the mappings had to work where most songs actually sit.
Valence
Hover or tap a bar to see its value range, record count and percentage. Use the arrow keys to move between bars, Home or End to jump to the first or last bar, and Escape to dismiss the tooltip.
A broad spread across the scale, with the average close to the midpoint.
Acousticness
Hover or tap a bar to see its value range, record count and percentage. Use the arrow keys to move between bars, Home or End to jump to the first or last bar, and Escape to dismiss the tooltip.
42.3% of records fall below 0.1: a strong concentration at the less-acoustic end.
Energy
Hover or tap a bar to see its value range, record count and percentage. Use the arrow keys to move between bars, Home or End to jump to the first or last bar, and Escape to dismiss the tooltip.
72.0% of records score above 0.5, shifting the distribution toward higher energy.
Danceability
Hover or tap a bar to see its value range, record count and percentage. Use the arrow keys to move between bars, Home or End to jump to the first or last bar, and Escape to dismiss the tooltip.
75.4% of records sit between 0.4 and 0.8, concentrating around the middle.
Loudness
Hover or tap a bar to see its value range, record count and percentage. Use the arrow keys to move between bars, Home or End to jump to the first or last bar, and Escape to dismiss the tooltip.
Loudness clusters toward the louder end, with a long tail of quieter recordings.
Tempo
Hover or tap a bar to see its value range, record count and percentage. Use the arrow keys to move between bars, Home or End to jump to the first or last bar, and Escape to dismiss the tooltip.
80.7% of records fall between 80 and 160 BPM. The largest group is 120–130 BPM.
Classic
Six numbers, one abstract visual.
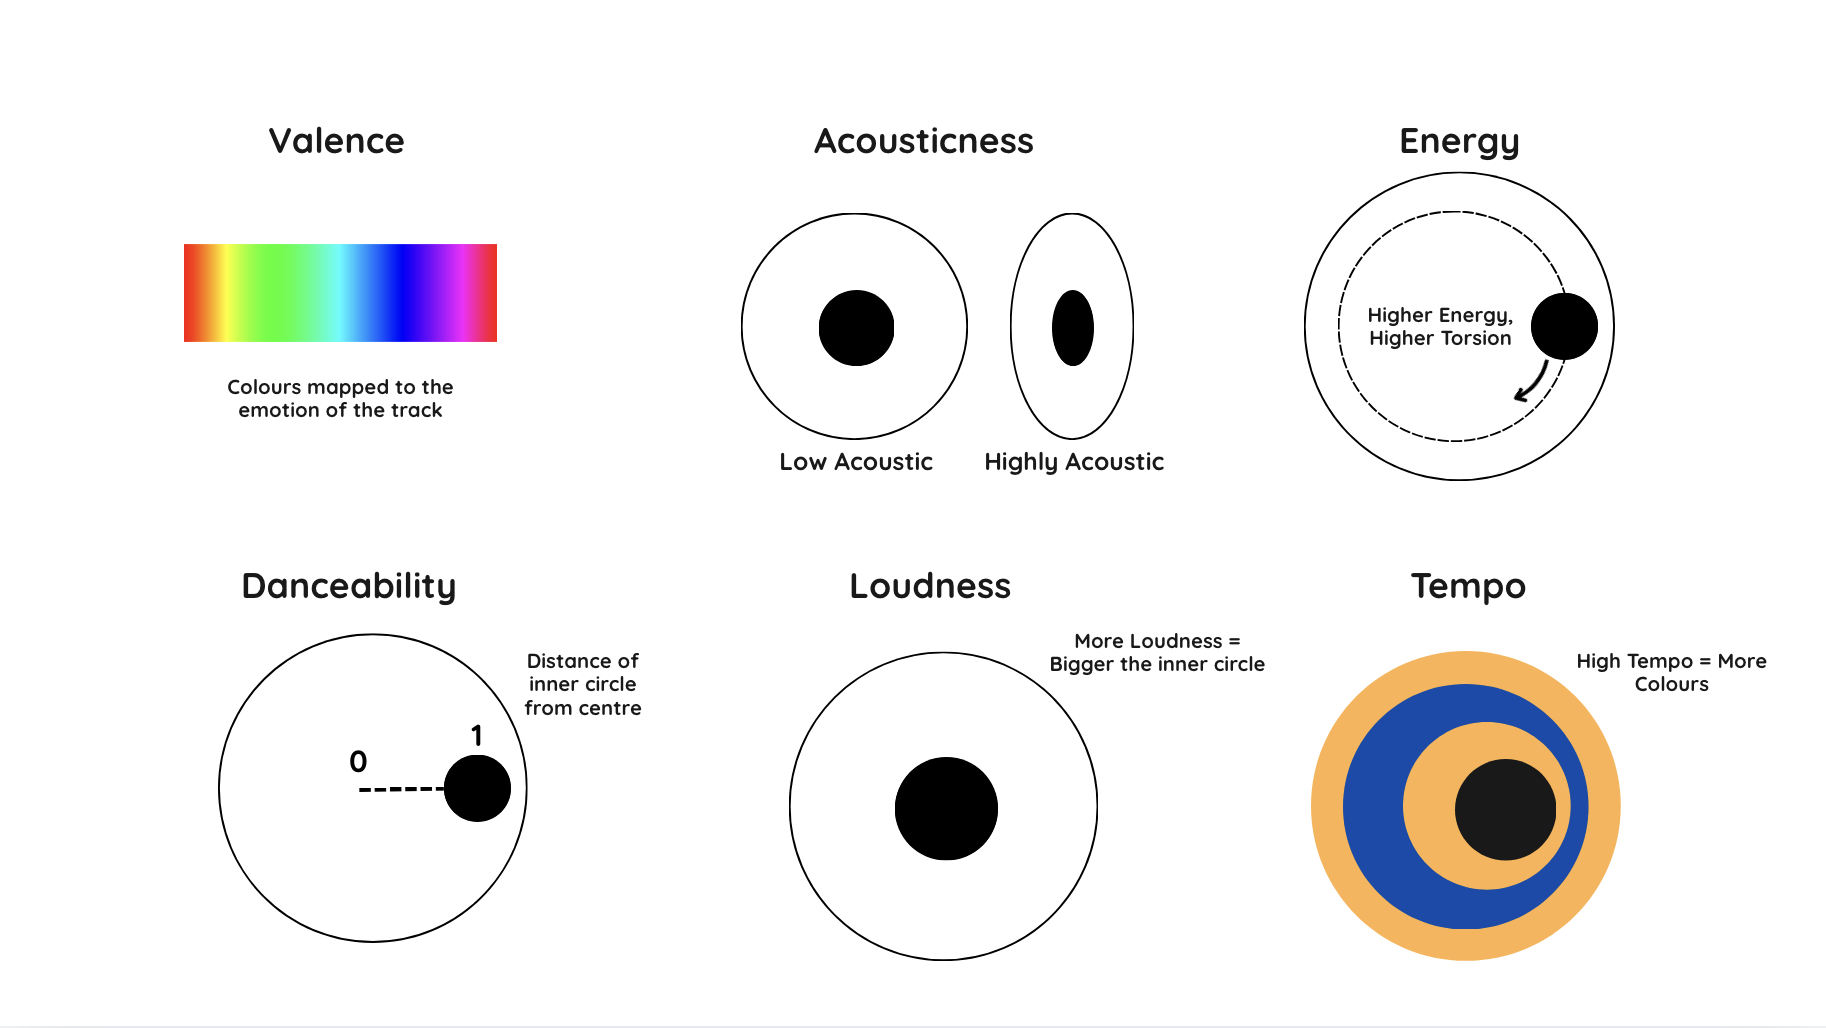
The first notebook sketches explored how a circle could hold several kinds of information at once. Colour, width, direction, offset, scale and layers each found a role: the outer ellipse, smaller coloured layers, an offset central circle, and a soft blur bringing them together.
Emotion becomes colour. Valence controls the hue, saturation and brightness of the composition.
Acousticness changes the ellipse's width: a rounder form at the low end, a narrower one at the high end.
Energy sets the direction in which the shapes shift away from the centre.
A danceable track moves the inner circle farther from the centre, creating an offset composition.
Loudness changes the size of the inner circle. A louder track gives it more visual weight.
Tempo becomes layering. A faster track produces more overlapping coloured layers.
As It Was in Classic.
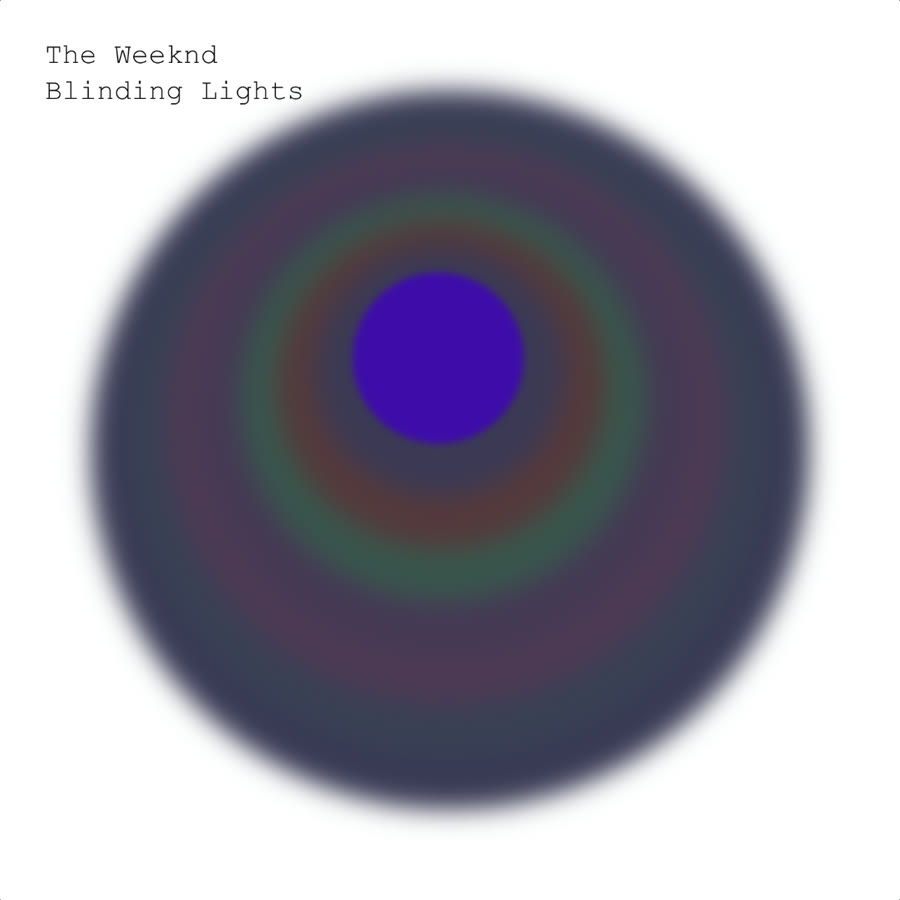
Blinding Lights in Classic.
Resonance
A moving form, a frame to keep.
Hundreds of fine filaments build a dimensional form, with seeded noise bending the geometry into folds and ribbons. Acoustic tracks lean toward an organic bloom, danceable ones form an orbit, and the rest become a folded current.
Resonance moves gently, with tempo influencing its pace. This animates the visual rather than playing the song or syncing to a beat, and a download saves the exact frame you paused on.
As It Was.Blinding Lights.
Pigment
New variation, same data.
Washes, dry bristles, scraped colour and scattered flecks build a textured painting, with lettering drawn from an irregular, crayon-like alphabet. Energy adds strokes and roughens their edges; acousticness balances bleeding edges with dry bristles.
The song and edition number seed the composition, so the same pair always reproduces the same artwork. New variation changes only that seed. All six values stay intact.
Five editions of As It Was.
A saved edition, kept as a PNG.
Sandbox
Change a value. Watch what it does.
Search the included catalogue, or make the six inputs editable in Sandbox and see each one’s effect on the drawing. Here lowering energy and pushing acousticness up turns a closed ring into a many-lobed bloom.
Under the hood
A saved catalogue, a live drawing process.
Spotify originally made these audio features available through its API. After access was restricted for new apps in November 2024, I used a saved Kaggle dataset. The generator doesn’t analyse a recording or search Spotify live. Each renderer scales the stored values into drawing ranges and the browser draws the result on a canvas, with p5.js noise giving Resonance and Pigment their irregularity.
The project
Find a song. Take a poster home.
Try a style, make a new variation, and save a 1500 × 1500 PNG.